How to get started?
For this first example we take a typical situation: - we have no idea about the software and possible solutions - we have no idea about LiDAR data processing and analysis - we just google something like lidR package tutorial
Among the top ten is The lidR package book . So let’s follow the white rabbit…
Creating a Canopy Height Model (CHM) reloaded
After successful application of the tutorial we will transfer it into a suitable script for our workflow. Please check the comments for better understanding and do it step by step! again. Please note that the following script is meant to be an basic example how: - to organize scripts in common - with a hands on example for creating a canopy height model.
After revisiting the tutorial is seems to be a good choice to follow the tutorial of the lidR developer that is Digital Surface Model and Canopy Height model in the above tutorial. Why? because for the first Jean-Romain Roussel explains 6 ways how to create in a very simple approach a CHM, second to show up that it makes sense to read and third to loop back because it does not work with bigger files. Let us start with the new script structure.
Basic Script to derive a Canopy Height Model
lidR catalog - coping with computer memory resources
The above example is based on a las-tile of 250 by 250 meter. That means a fairly small tile size. If you did not run in memory or CPU problems you can deal with these tiles by simple looping.
But you have to keep in mind that even if a tile based processing can easily be handled with loops but has some pitfalls. E.g. if you compute some focal operations, you have to make sure that if the filter is close to the boundary of the tile that data from the neighboring tile is loaded in addition. Also thelas tile size may be a problem for your memory availability.
The lidR package comes with a feature called catalog and a set of catalog functions which make tile-based life easier. A catalog meta object also holds information on e.g. the cartographic reference system of the data or the cores used for parallel processing. So we start over again - this time with a real data set.
Please note that dealing with lidR catalogs is pretty stressful for the memory administration of your rsession. So best practices is to Restart your Rsesseion and clean up your environment. This will help you to avoid frustrating situation like restarting your PC after hours of waiting…
Using lidR catalog to derive a canopy height model
The following script will setup a lidR catalog and a more sophisticated approach to calculate the DEM, DSM and CHM. Please note that you have to exchange the code snippet dealing with the LiDAR data, If not already done download the course related LiDAR data set of the MOF area (VPN required) . Store the the data to the e.g. envrmt$path_l_raw folder.
VRT workaround
Complete catalog script
Check the catalog
# check new ctg
las_check(norm_ctg)
##
## Checking headers consistency
## - Checking file version consistency...[0;32m ✓[0m
## - Checking scale consistency...[0;32m ✓[0m
## - Checking offset consistency...[0;32m ✓[0m
## - Checking point type consistency...[0;32m ✓[0m
## - Checking VLR consistency...[0;32m ✓[0m
## - Checking CRS consistency...[0;32m ✓[0m
## Checking the headers
## - Checking scale factor validity...[0;32m ✓[0m
## - Checking Point Data Format ID validity...[0;32m ✓[0m
## Checking preprocessing already done
## - Checking negative outliers...
## [1;33m ⚠ 8 file(s) with points below 0[0m
## - Checking normalization...[1;33m maybe[0m
## Checking the geometry
## - Checking overlapping tiles...[0;32m ✓[0m
## - Checking point indexation...[0;31m no[0mThe visualization of an operating lidR catalog action.
The ctg catalog shows the extent of the original las file as provided by the the data server. The vector that is visualized is the resulting lidR catalog containing all extracted parameters. Same with the ctg here you see the extracted maximum Altitude of each tile used for visualization. Feel free to investigate the catalog parameters by clicking on the tiles.
#--- plots
mapview(chm, zcol="Max.Z",col.region=viridis::viridis(16))
Let’s plot the results
You will find below some very common approaches to visualize the results as a map. Please note this are just very basic maps for getting a first impression of the data.
mapview
#- mapview plot
mapview::mapview(chm,layer.name = "pitfree chm 1sqm tree height [m]",col.regions=lidR::height.colors(20))
Base plot
#- classic plot
plot( chm,
      col = lidR::height.colors(20),
      main = "pitfree chm 1 m² cells",
cex.main = 1) 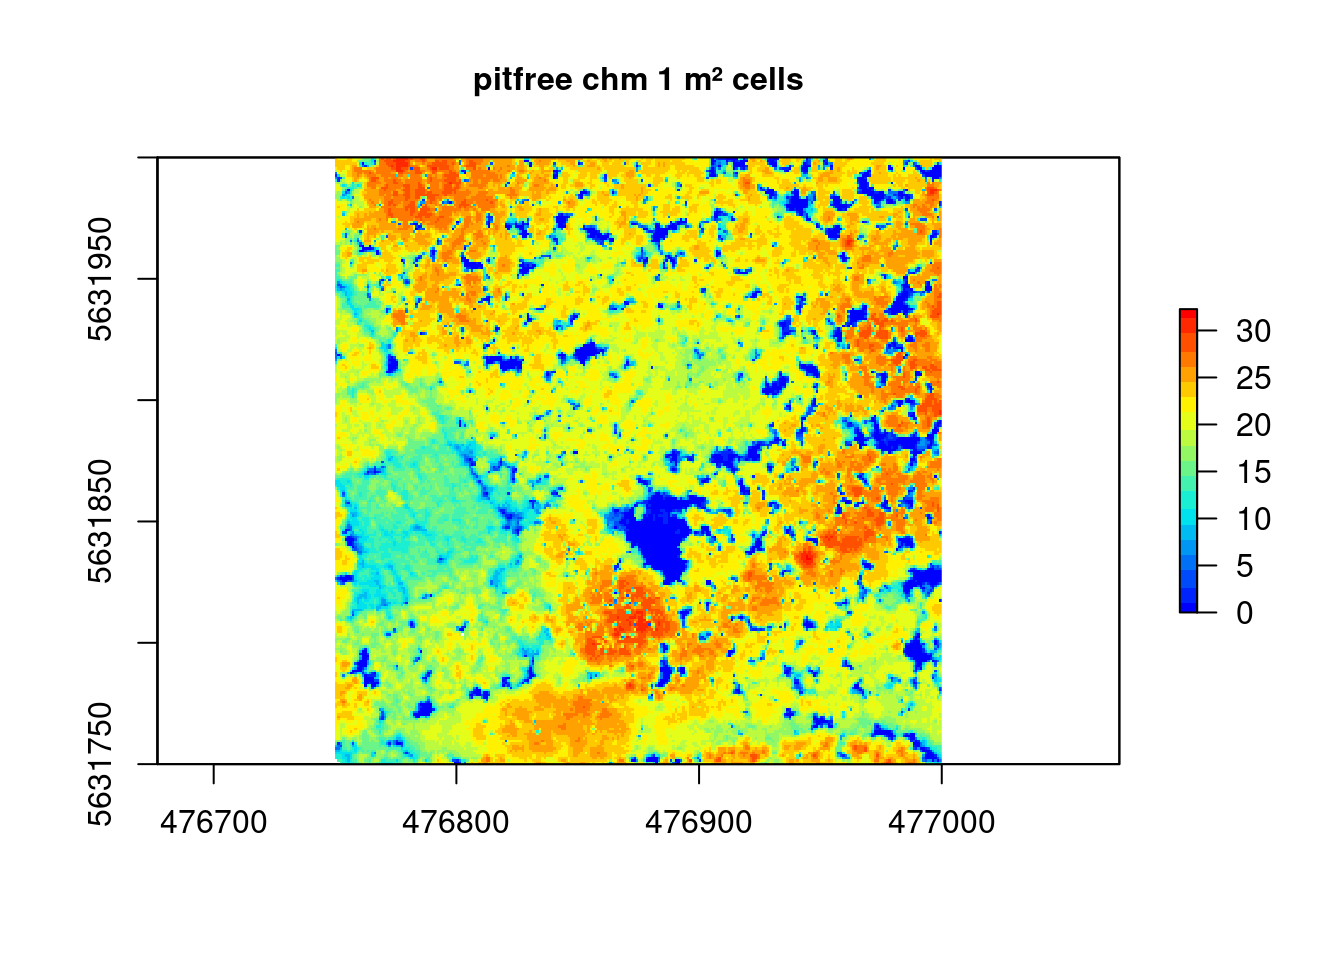
tmap plot
#- tmap plot
tmap::tm_shape(chm) +
tmap::tm_raster( title = "pitfree chm 1 m² cells", palette = lidR::height.colors(20)) +
  tm_grid()+
  tm_layout(legend.outside = TRUE)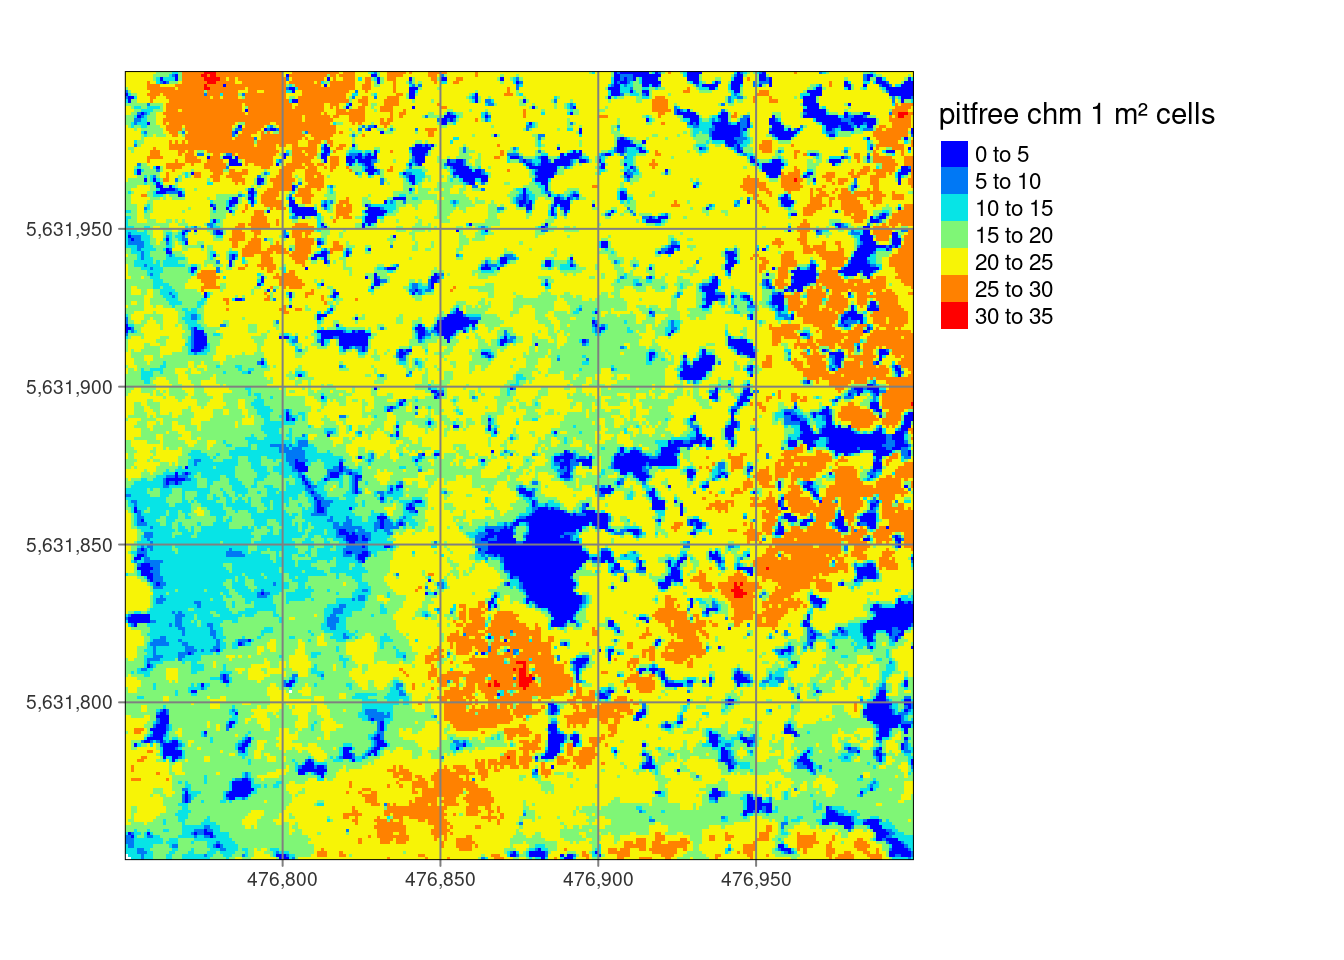
ggplot
#- ggplot plot with stars
ggplot2::ggplot() +
stars::geom_stars(data = stars::st_as_stars(chm)) +
ggplot2::scale_fill_gradientn(colours=lidR::height.colors(20)) +
ggplot2::coord_equal()+
ggplot2::guides(fill=guide_legend(title="pitfree chm 1 m² cells"))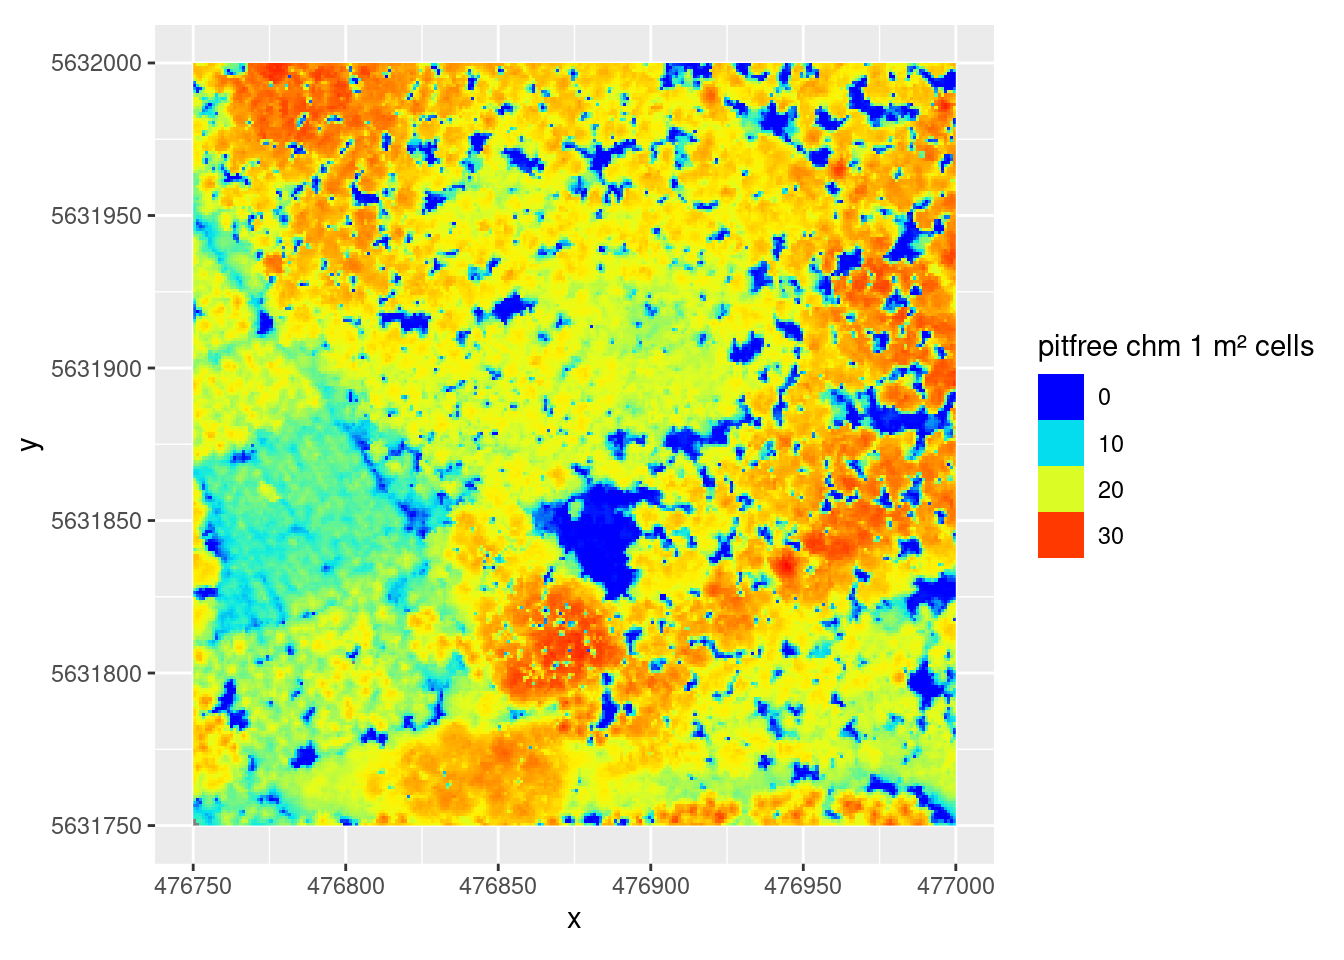
The real challenge
Assuming the above script (or the scripts you have adapted) runs without any technical errors, the exciting part of the data preprocessing comes now. In addition we ave to cross check and answer a lot of questions:
- Which algorithms did I use and why?
- 45m high trees - does that make sense?
- If not why not?
- What correction options do I have and why?
- Is the error due to the data, the algorithms, the script or all together?
- …
Where to go?
To answer this questions we need a two folded approach. - First we need technically to strip down the script to a real control script, all functionality that is used more than once will be moved into functions or other static scripts. - Second from a scientific point of view we need to find out what algorithm is most suitable and reliable to answer the question of calculating a set of paramters for deriving structural forest index classes. This also includes that we have to decide which classes and why… .
Ressources
- You find all related materials at the aGIS Ressource post.
Questions and mistakes but also suggestions and solutions are welcome.
Due to an occasionally faulty page redirection, a 404 error may occur. please use the alternative
Comments & Suggestions