What about GIS now?
However, all the concepts do not clarify the concrete digital or technical implementation. The considered geo objects of the real world contain a wealth of information that still strives towards infinity. The same applies even more to the continuum of space, which can be arbitrarily complex depending on the scale. For the digital representation of spatial features, we therefore need an efficient and simple method to operate information and data reduction.
GIS Definition
Despite the diversity of the term “GIS”, the following structural (and a bit trivial) definition has prevailed. “GIS is a computerized information system that consists of the four components hardware, software, data, and applications”. Actually that means that “with a GIS””, spatial data can be digitally recorded and checked, stored and reorganized, modeled and analyzed and presented alphanumerically and graphically. (Bill 2016)
Data Models
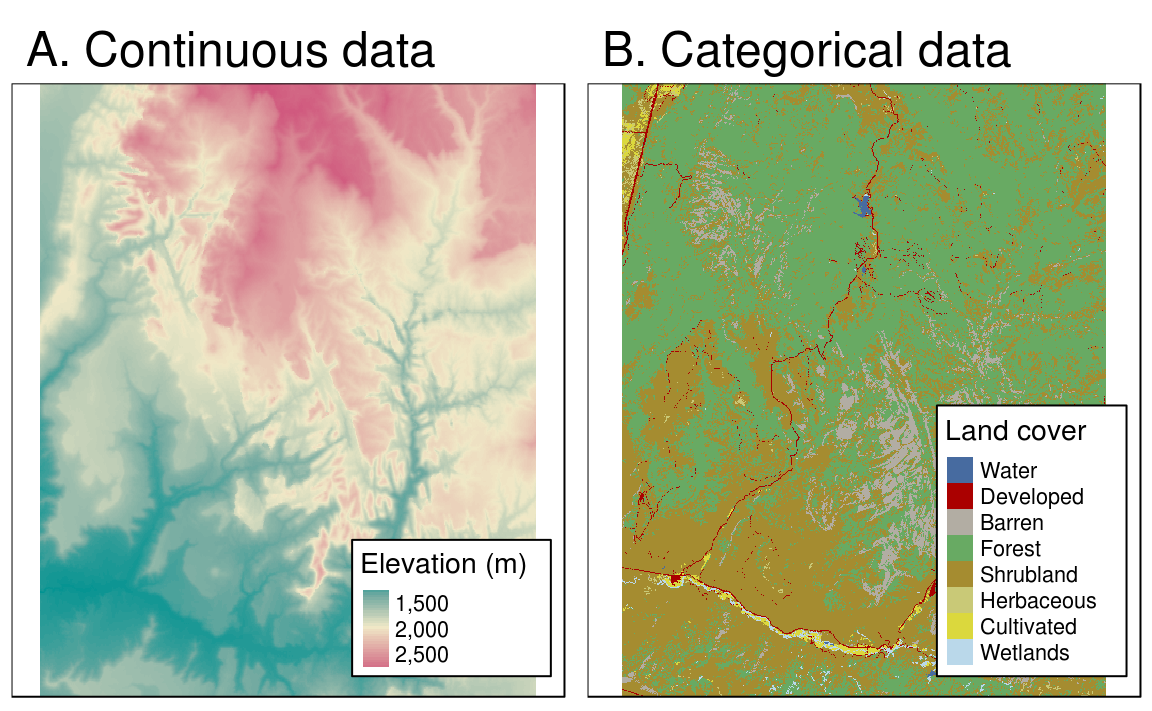
The basis for the reduction of information is formed by so-called data models. A data model is formed by the abstraction of individual objects (entities) and their properties (attributes). In this process, the same object types (eg, rivers, federal highways, urban areas) are summarized. In the application of GIS, two completely different data models have been established for this purpose, which are called raster model or vector data model. Both data models are principally usable for the representation of continuous properties as well as discrete geo objects. In practice, however, continuous data is usually mapped in the raster data model and discrete data in vector data format. Please note that the mentioned data models can not only be used for the representation of time-definite characteristic values, but also for time-varying characteristics.
Vector data model
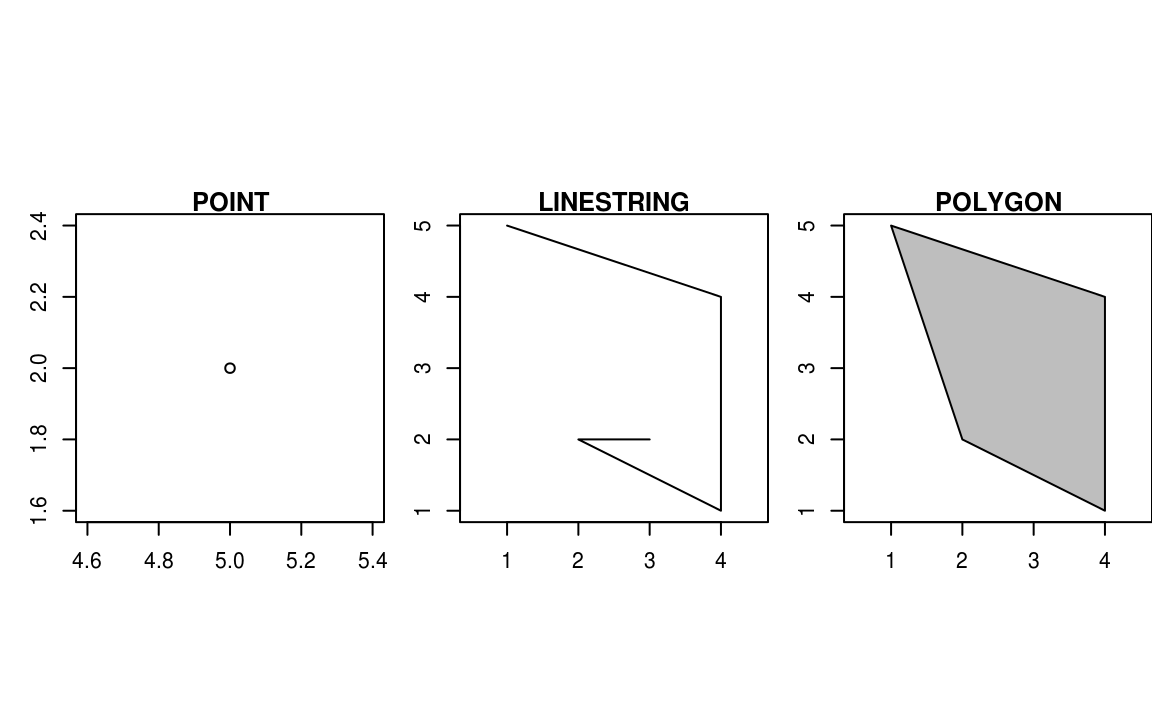
In a Cartesian coordinate system, which is necessary for the representation of a Euclidean geometry, arbitrarily complex spatial structures for the modeling of geoobjects can be constructed from the basic element point.

In school, you have come to know such points as vectors, and in geo-informatics and the topological context of geography, one speaks of knots. If we have referenced two nodes in the coordinate system, we can connect these nodes by a line topologically called an edge.
If not only two nodes are connected by an edge, but as a result of the connection of at least three nodes by edges a closed surface arises, we speak of a polygon or topologically of a mesh. In GI systems, nodes are usually referred to as points, non-closed connections of edges as lines, and meshes as polygons.
Raster data model
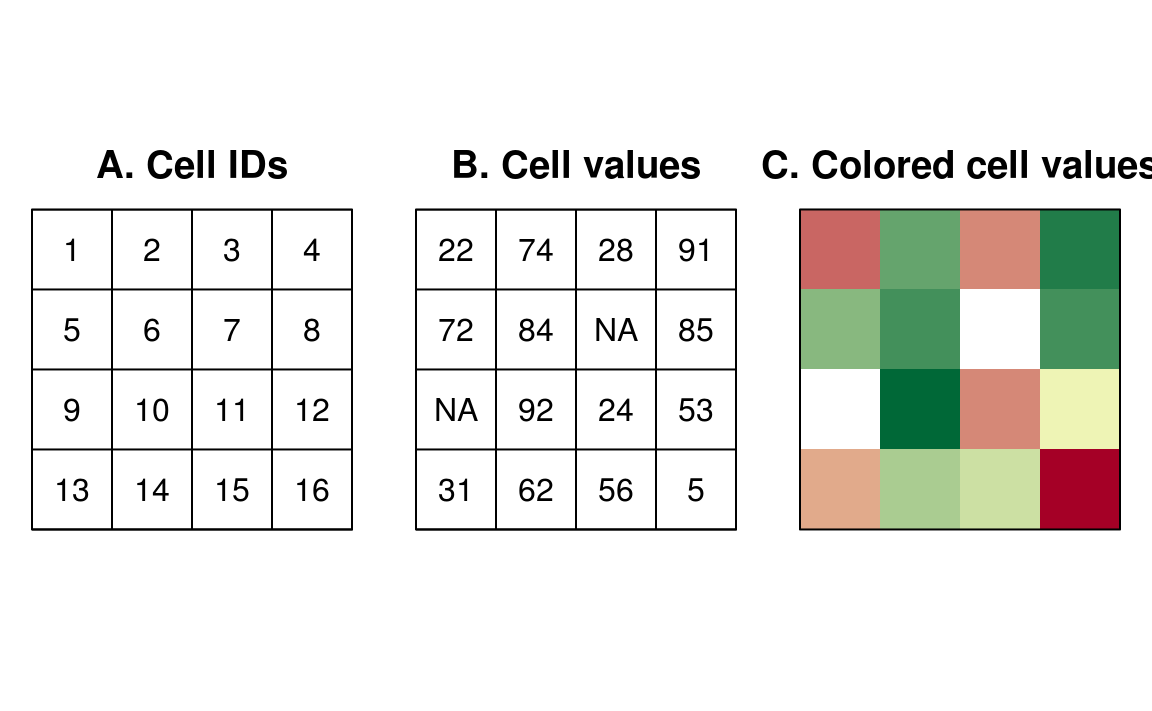
Unlike the vector data model, in raster data models, space is always mapped using two- or three-dimensional objects in any shape and size, but without overlapping or gaps. The characteristic values are stored as numerical values assigned to each cell.

Arranging the non-intersecting cells in rows and columns creates an implicit spatial reference of each cell. It should be noted that the origin of a raster image always lies in the upper left corner and is usually counted from there by the two run indices i, j. As a result, each pixel is uniquely identifiable. In this way, an explicit spatial reference is available with respect to each pixel.

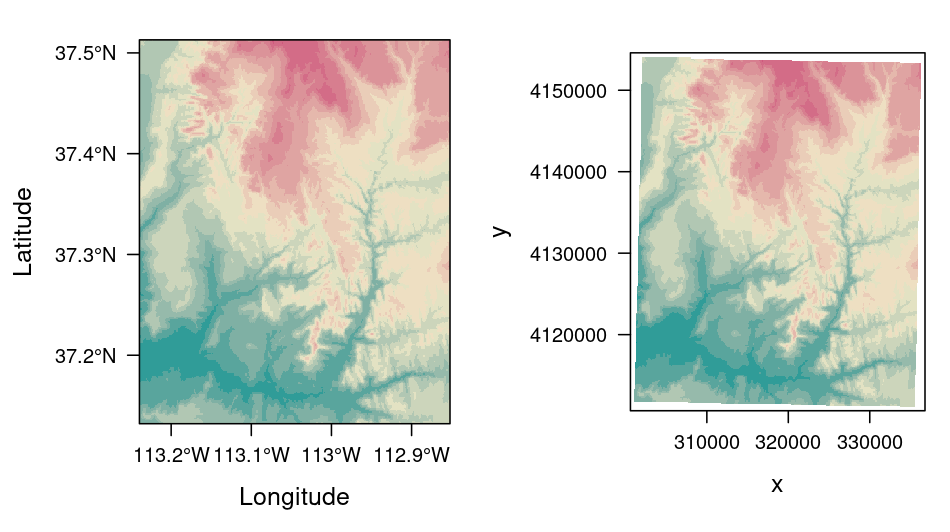
However, this explicit spatial concept is not yet located in a defined Cartesian coordinate system or in the real world. This location is necessary both for the joint use of raster data with vector data, as well as essential for the geographical referencing of the raster cells with respect to the real world. Therefore, raster data models are basically also provided with a Cartesian coordinate system. However, this has the origin (as usual) in the lower left corner. The grid cells can therefore be identified both by their index and by the Cartesian coordinate system in space.

Further Reading
- A more detailed information for raster data can be found at Geocomputation with R - Raster data.
- A more detailed information for vector data can be found at Geocomputation with R - Vector data.